
Navigating Persistent Uncertainty
After six straight years of markets contending with another “unprecedented time” during the first quarter of a new year, one begins to wonder: at what point does this continued streak of historic first-quarter inflection points become a precedent in its own right? The first quarter of 2026 has become the most recent rendition, requiring investors to maintain disciplined navigation through persistent uncertainty.
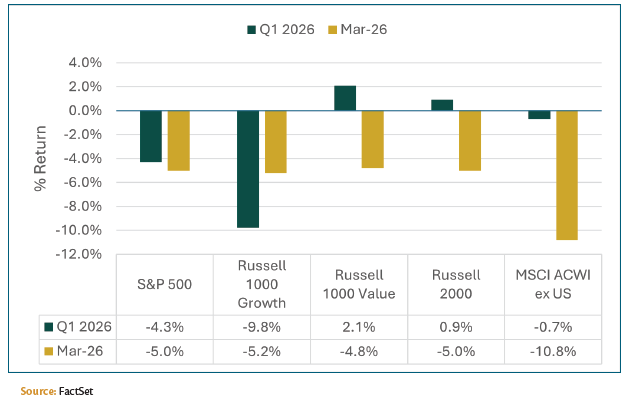
While S&P 500 index returns through March 31st posted a low single-digit decline of -4.3%, we were pleased to see continued broadening of positive investment returns across multiple segments of U.S. and global markets. We continue to anticipate that 2026 will be a year in which both equity markets and corporate profits “climb the wall of worry” amid ongoing market transitions and elevated geopolitical uncertainty — dynamics that continue to play out in real time.
We’ve outlined the three prominent themes that are likely to continue shaping capital markets and the global economy throughout the remainder of 2026.
1. Climbing the Wall of Worry: A Tug-of-War Between Earnings and Interest Rates –
The primary focus for much of the market remains the tension between robust corporate fundamentals and the gravitational pull of elevated long-term interest rates.
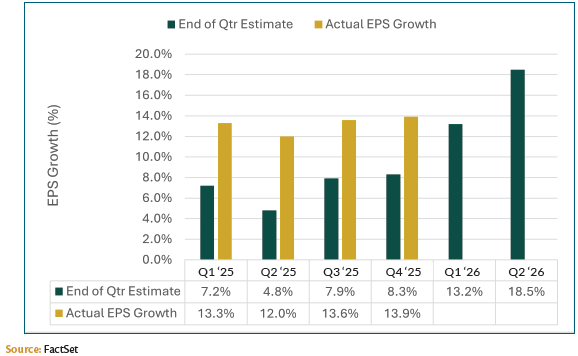
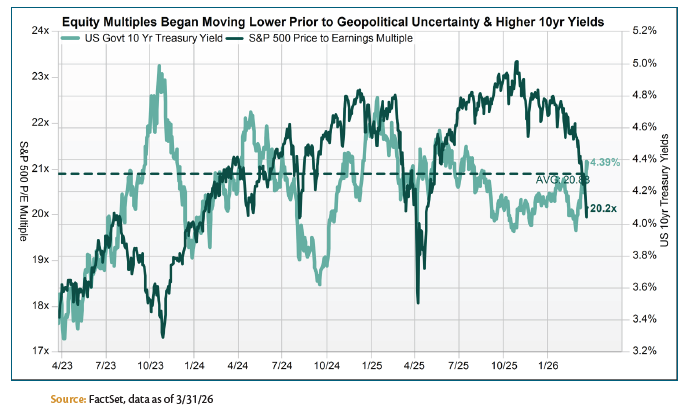
Despite a challenging interest-rate environment, equity markets appear to have found a footing. Higher rates following the escalation of Middle East hostilities have kept equity valuation multiples under pressure. Notably, however, multiples had already been contracting throughout the fourth quarter of 2025 as corporate earnings growth outpaced investor expectations. This dynamic is typical of markets facing a classic “wall of worry,” and it often creates attractive investment opportunities where real earnings growth — and eventual multiple expansion — can drive future returns.
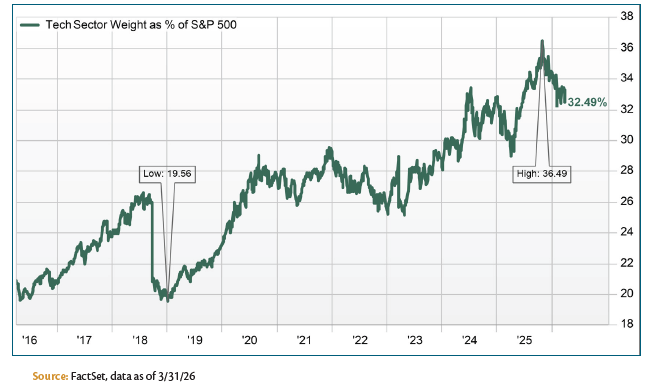
In addition to interest-rate and geopolitical uncertainty, the Technology sector in particular faces a fundamental investor question that will not be answered in a single quarter. The question is no longer simply “How can you use AI?” but rather: “How much of your core software workflow is now more efficiently provided by AI agents?” This uncertainty weighs on software valuations and, by extension, on the broader U.S. indices given technology’s outsized weight within the S&P 500. Until clarity emerges on AI’s displacement potential versus its productivity-enhancing potential, Tech will remain both a source of opportunity and a source of volatility as investors work to separate the “AI-disrupted” from the “AI-enabled.”
2. Markets in Transition
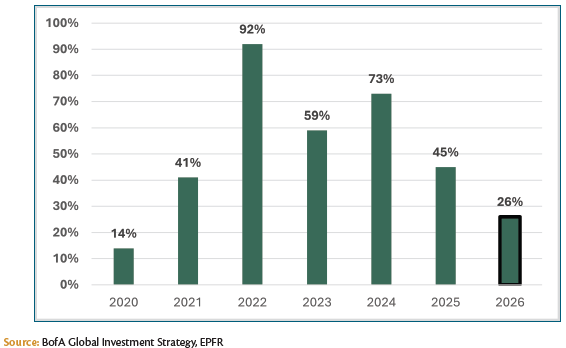
Beneath the surface, a structural rebalancing of global capital flows is well underway. In 2026, for every $100 of net new inflows into global equity funds, U.S. stocks have captured only $26 – the lowest share since 2020.
To put this in context: the U.S. share of global fund flows peaked at $92 in 2022, fell to $73 in 2024, and declined again to $45 in 2025.
Importantly, this “global rebalancing” has so far manifested as a smaller share of relative inflows rather than outright outflows from U.S. assets. This trend is unlikely to meaningfully reverse as higher interest rates and elevated inflation have become more ubiquitous across foreign economies than in prior years.
US Share of Global Fund Flows (%):
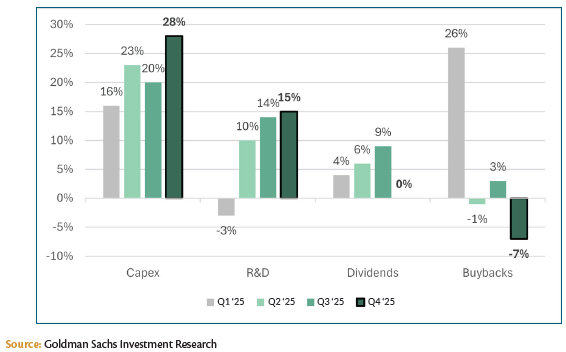
S&P 500 Cash Utilization Growth (% change YoY):
3. Middle East Update – The Geopolitical Overlay
The duration of the Middle East conflict remains the single most important variable for global markets and central banks alike. In the short run, inflation considerations remain a primary concern, as higher energy prices and supply-chain frictions are likely to keep headline CPI prints firmer than many expected entering the year. Over a longer horizon, a sustained conflict could impose a measurable drag on global growth through higher commodity costs and logistical uncertainties around the Strait of Hormuz.
For now, central banks have adopted a wait-and-see posture. With elevated uncertainty around both the conflict’s length and its second-order effects, policymakers have turned cautious, opting to hold policy rates steady rather than committing to either aggressive easing or further tightening.
If the conflict proves relatively short in duration, market conditions remain favorable for continued broadening of market returns — a trend already visible through stronger relative performance in international equities and domestic small- and mid-cap stocks. A de-escalation scenario would likely reinforce this rotation, as capital allocators seek attractive returns beyond the most concentrated areas of the U.S. equity market.
Outlook
We enter the second quarter with a consistent and disciplined framework that has guided us through the first:
- Continue to take advantage of opportunities that arise from “micro-rotations” and elevated volatility across industries
and asset classes. - Monitor long-term yields and the pace of AI-related capital spending as the two most important near-term drivers of
U.S. equity market performance. - Track the trajectory of the Middle East conflict as the dominant geopolitical variable.
Our base case remains constructive on a broadening global equity market, provided the conflict does not materially lengthen. We continue to favor a diversified portfolio that includes balanced exposures across global markets as well as domestic small- and mid-cap equities, while maintaining prudent risk controls around the most concentrated segments of the U.S. large-cap universe.